Views: 0 Author: Site Editor Publish Time: 2026-11-13 Origin: Site


Relying on subjective visual inspections to evaluate endoscope image quality leads to inconsistent diagnostic performance. It also causes costly integration failures during the product lifecycle. You need a better, mathematically sound method. Modulation Transfer Function (MTF) provides a quantifiable metric. It measures optical sharpness and contrast accurately. This approach entirely removes human error from the evaluation process.
This guide outlines a rigorous, objective framework. You will learn how to execute precise optical testing. We will help you validate supplier samples confidently before mass production. You will explore test setups, lighting requirements, and software analysis techniques. We will explain how to interpret center-to-edge variance effectively. You will also understand how to read spatial frequency response curves. By the end, you will have a standardized process. This ensures clinical-grade imaging reliability. Your team will stop guessing and start measuring.
MTF testing eliminates subjective bias by mathematically measuring how effectively a lens and sensor system transfers detail from object to image.
Standardized test environments (ISO 12233 charts, controlled lux levels) are mandatory for reliable camera module sample validation.
Center-to-edge sharpness variance is a critical evaluation metric, especially for identifying manufacturing defects in high-resolution endoscope cameras.
MTF data should directly drive vendor shortlisting, serving as a baseline for mass-production quality control and compliance documentation.
Engineers often use subjective visual checks to test lenses. They look at a printed resolution chart on a laboratory monitor. This approach invites massive risk. Human eyes perceive contrast differently. Monitors display colors and edges inconsistently. What looks incredibly sharp to one technician might look soft to another. MTF curves replace this dangerous guesswork. They offer pure mathematical certainty. You get hard data based on software calculations.
Integrating substandard optics creates severe financial and regulatory problems. Poor image quality directly leads to missed clinical diagnoses. Surgeons cannot operate safely using blurry video feeds. Furthermore, regulatory bodies demand strict performance data. Poor objective metrics delay your medical compliance approvals. You will spend months rewriting technical documentation. High return rates destroy your profit margins. Objective testing prevents these specific disasters.
A successful validation cycle requires repeatable data. You must test the same unit twice and get identical results. You must establish clear pass/fail thresholds early in development. Suppliers often make bold claims about their lenses. You need verifiable proof before signing procurement contracts. Reliable data protects your clinical application.
Always tie optical performance metrics to specific clinical use cases.
Document your testing environment variables strictly.
Keep calibration records updated for your light sources.
MTF calculates how well a system transfers detail. We measure this detail transfer using spatial frequency. The standard unit is line pairs per millimeter (lp/mm). A line pair consists of one pure black line and one pure white line. As these lines get closer together, resolving them becomes much harder. The pure black and pure white blur together into a gray mush. The contrast drops significantly.
An MTF curve visualizes this relationship perfectly. You read the graph easily. The vertical y-axis represents the contrast percentage. The horizontal x-axis shows spatial frequency. A theoretical perfect lens scores 100% contrast across all frequencies. Real-world optics naturally decline as spatial frequency increases. You look for the specific point where contrast drops below acceptable visual levels.
You must distinguish between optical MTF and system MTF. Optical MTF evaluates just the raw lens capability. System MTF evaluates the lens, sensor, and Image Signal Processor together. You cannot test the lens in isolation effectively for integrated units. You must test the fully assembled module. If the sensor limits the lens, your optical MTF data is useless. System MTF reveals the true output quality you will see on the surgical display.
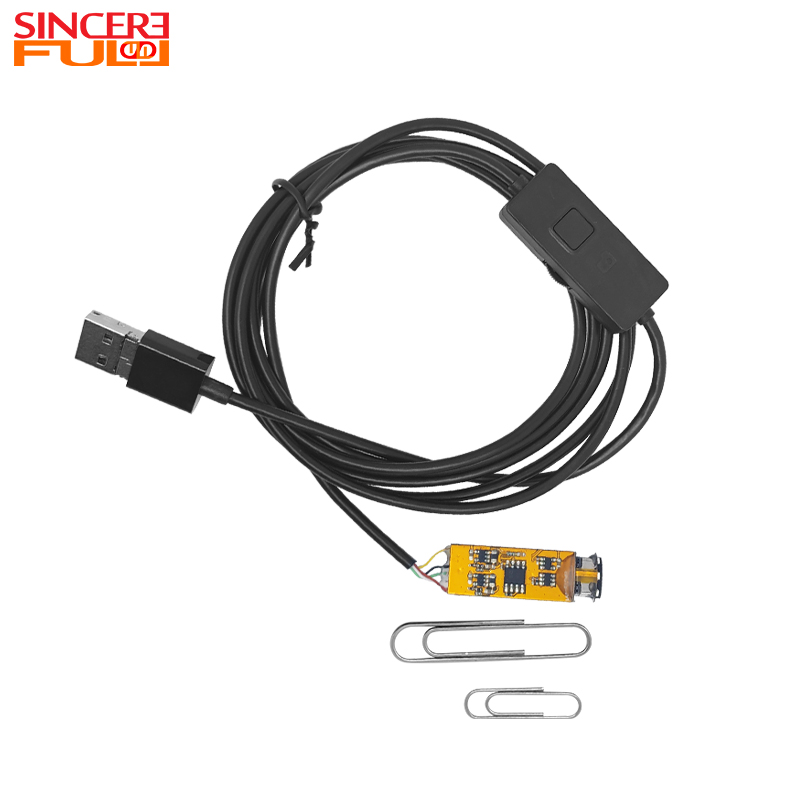
Standardizing your environment is essential. Variability ruins data integrity during camera module MTF testing. You must control every external variable.
Choose the right target carefully. Slant-edge ISO 12233 charts are the current industry standard. They provide precise spatial frequency response data. Engineers tilt the square edges slightly. This allows the software to calculate sub-pixel resolution. Sinusoidal targets also work well but require different analysis tools. Alignment remains absolutely critical. Ensure perfect perpendicularity between the sensor and the chart. Use precision mounting rigs. Calculate test distances based on the exact Field of View. An incorrect distance skews the spatial frequency calculations completely.
Illumination must remain uniform across the entire chart. We highly recommend using a D65 light source. It simulates natural daylight accurately. Keep lux levels constant and measurable. Use a calibrated lux meter before every test. Uneven lighting introduces sensor noise in darker corners. Noise artificially degrades MTF scores. It tricks the software into reading false edges.
Capture raw or completely uncompressed image data. ISP artifacts destroy test validity entirely. Sharpening algorithms falsely inflate MTF scores. They create artificial halos around edges. Noise reduction algorithms blur these critical edge transitions. Use established software analysis tools. Industry-standard software generates highly accurate graphs.
Position the module exactly perpendicular to the slant-edge chart.
Set uniform D65 illumination across the entire target area.
Measure the lux level at the center and all four corners.
Capture uncompressed RAW images to bypass ISP sharpening.
Import the raw files into your analytical software.
Record the Spatial Frequency Response values for all fields.
A high resolution endoscope camera demands stringent evaluation criteria. Center sharpness usually remains excellent on most lenses. Peripheral sharpness is where cheap optics fail. Lenses naturally lose resolution toward the outer edges. Light rays bend at steeper angles. You must define acceptable degradation thresholds for medical imaging. A 20% drop might pass for basic industrial inspection. Clinical diagnostics require much tighter tolerances. Surgeons rely on edge clarity to navigate narrow anatomical spaces safely.
Endoscopes navigate dynamic environments inside the human body. The distance between the lens and tissue changes constantly. Therefore, testing MTF at a single static focal plane provides incomplete data. Evaluate the spatial frequency response across the entire intended working distance. For a rigid laparoscope, test from 30mm out to 150mm. Document how quickly the contrast drops as you move away from the optimal focal point. A lens presenting exceptional center sharpness but an extremely shallow depth of field fails clinical requirements. Surgeons cannot stop to refocus continually.
The optics must actually resolve the detail. A high-density sensor demands excellent glass. A bad lens bottlenecks a system completely. You cannot fix bad glass by adding more pixels. Validating a 12MP autofocus camera module requires a specialized lens. It must handle high lp/mm targets effectively. Otherwise, the extra sensor resolution is entirely wasted. The system merely captures higher-resolution blur.
Even experienced engineers make mistakes during optical evaluation. Understanding these risks prevents false data. Image processing interference is the most common error. Built-in edge enhancement invalidates raw optical MTF data. Camera software often applies aggressive sharpening automatically. Noise reduction algorithms smooth over critical edge transitions. You must disable the ISP during testing. If you cannot disable it, you are not testing the optics. You are merely testing the software algorithms. This leads to wildly inaccurate performance assumptions.
Mechanical misalignment ruins slant-edge calculations. Microscopic tilt between the test chart and the sensor plane alters results. It changes the perceived sharpness across the frame. One side will score artificially high. The other side will score artificially low. Use laser alignment tools. Do not rely on visual alignment methods. The human eye cannot detect a one-degree tilt accurately.
Beware of the infamous "golden samples." Suppliers often hand-pick flawless units for your initial evaluation. Testing a single unit guarantees nothing about mass production. You must validate a statistical batch. A single great lens means they can make one. It does not mean they can make ten thousand units reliably.
Testing Pitfall | Impact on MTF Data | Corrective Action |
|---|---|---|
Active ISP Sharpening | Artificially inflates MTF scores, creating false confidence. | Capture only RAW data or disable all ISP image processing. |
Uneven Chart Illumination | Introduces shadow noise, degrading peripheral sharpness scores. | Use uniform D65 lighting and verify with a calibrated lux meter. |
Sensor Plane Tilt | Asymmetrical sharpness results between left and right edges. | Employ laser alignment tools to ensure strict perpendicularity. |
Testing Golden Samples | Fails to account for actual mass-manufacturing variances. | Demand a random batch of 5-10 units for baseline testing. |
Objective data simplifies vendor shortlisting. You remove emotion and sales pitches from the equation. You can use MTF50 and MTF20 benchmarks to rank competing suppliers objectively. MTF50 correlates strongly with perceived human sharpness. It represents the spatial frequency where contrast drops to 50%. MTF20 indicates the absolute resolution limit. It shows the finest detail visible before contrast vanishes. Compare these numbers directly across suppliers. Rank vendors based on these hard metrics.
Consistency matters more than peak performance. A narrow variance across multiple samples is crucial. One anomalous high-scoring module during camera module sample validation means nothing. It fails if the next ten units perform poorly. You need predictable manufacturing yields. High variance indicates poor factory quality control. It suggests cheap lens barrel assembly. Prioritize vendors who deliver stable, predictable data across entire batches.
Moving from sample approval to mass production requires strict rules. Establish Minimum Acceptable Quality limits immediately. Put these specific MTF limits into your Service Level Agreements. Hold the supplier financially accountable to these numbers. If mass-production units fall below the agreed MTF50 baseline, reject the shipment. This data-driven approach protects your supply chain flawlessly.
MTF testing remains the only defensible method. It evaluates endoscope sharpness accurately. Subjective visual checks belong in the past. Mathematical contrast analysis ensures diagnostic reliability. It protects your clinical users effectively.
We strongly advise engineering teams to demand raw MTF test reports upfront. Ask suppliers for these documents before ordering any physical samples. It filters out unqualified vendors immediately. A supplier unable to provide an MTF curve cannot meet modern clinical standards.
Standardize your in-house validation protocols today. Finalize these procedures before signing any procurement contracts. This objective approach guarantees product quality. It builds trust with medical professionals. Make measurable optics the foundation of your engineering process.
A: MTF50 represents the spatial frequency where contrast drops to 50%. It correlates strongly with human perceived sharpness. MTF20 marks the frequency where contrast falls to 20%. This indicates the absolute maximum resolvable detail before the image becomes a gray blur. Engineers use MTF50 for general sharpness tuning. They use MTF20 to determine the absolute limit of the optical system.
A: No, you should never test on compressed video. Compression algorithms merge pixels to save bandwidth. This process destroys critical high-frequency details. It creates artifacts along high-contrast edges. Furthermore, built-in ISP sharpening filters will falsely inflate your spatial frequency response. You must always use RAW or uncompressed lossless image capture. This guarantees you are testing pure optical capabilities.
A: Your high-megapixel sensor is likely paired with inferior optics. A 12MP sensor has a much smaller pixel pitch than a 4MP sensor. The lens must resolve incredibly fine details to feed those tiny pixels. If the lens lacks resolving power, the high-density sensor simply captures higher-resolution blur. A perfectly balanced 4MP system will yield higher pixel-level contrast than a bottlenecked 12MP system.
A: We recommend testing a baseline of 5 to 10 random units. Testing a single unit exposes you to the golden sample trap. A larger batch allows you to identify critical manufacturing variances. You will quickly spot issues like optical decentering, sensor plane tilt, and poor adhesive curing. Consistent MTF scores across 10 units prove the supplier has reliable quality control.


